Understanding Gene Expression Through RNA Sequencing
This article follows the full arc of an RNA-seq project: what the technology is, what it can reveal, how to design a study that will actually answer your question, how to interpret the results, and where the field is heading.

Introduction
There is a gap between knowing which genes exist in a genome and knowing which ones are switched on right now, in this tissue, under these conditions. For a long time, that gap was bridged by two technologies: quantitative PCR (qPCR), which is accurate but can only measure a handful of genes at once, and microarrays, which covered thousands of genes simultaneously but required the researcher to specify which genes to look at in advance.
Both share a deeper limitation: the world does not know in advance which genes matter. Biology rarely cooperates with hypotheses. Microarrays in particular struggled with cross-hybridisation artefacts, poor quantification at expression extremes, and a hard requirement to know the sequence of interest before the experiment begins. [1]
RNA sequencing (or RNA-seq as it’s known in the field) changed that. It reads the entire transcriptome without any prior assumption about which transcripts will be present or relevant. [2]
Put simply: instead of asking specific questions about a cell, RNA-seq just listens to everything the cell is saying simultaneously, genome-wide, at single-nucleotide resolution.
That openness is its main advantage. It is also what makes experimental design and data interpretation so important. Good RNA-seq is a conversation between biologists, wet-lab scientists, and bioinformaticians; a poorly designed experiment produces data that is expensive, noisy, and almost impossible to interpret meaningfully.
This article follows the full arc of an RNA-seq project: what the technology is, what it can reveal, how to design a study that will actually answer your question, how to interpret the results, and where the field is heading.
Whether you work in biomedical research, toxicology, cosmetics, or drug development, the core logic is the same.
1. What Is RNA-seq?
A simple definition
DNA is the archive. It contains the complete instruction set for an organism, but most of it sits quietly most of the time. What a cell does at any given moment depends on which instructions are currently being read. That reading process produces messenger RNA (mRNA) molecules — transient copies of specific DNA sequences, translated downstream into proteins. The complete collection of RNA molecules present in a cell or tissue at a specific moment is the transcriptome.
RNA-seq sequences that collection. It converts RNA into complementary DNA (cDNA), fragments and sequences those molecules on a high-throughput platform, then counts how many reads map back to each gene. That count is a proxy for expression level: more reads mapping to a gene means more of that gene's RNA was present in the original sample. [3]
The contrast with DNA sequencing matters. Sequencing a genome tells you what a cell could do. RNA-seq tells you what it is actually doing at the moment of sampling, like a functional snapshot rather than a reference manual. And unlike microarrays, it does all this without any prior specification of which genes to look at.
"RNA-seq enables the accurate measurement of multiple transcriptomic phenotypes for modelling the impacts of disease variants."[1]
How RNA-seq works
Five phases separate a biological sample from a meaningful result. Each one is a potential source of error if poorly controlled , which is worth keeping in mind as we go through them.
1. RNA extraction: RNA is isolated from cells, tissue, blood, or any other biological material. The challenge is that RNA can degrade quickly. RNA integrity, which could be measured by the RIN score (a 1–10 scale), must meet a laboratory-specific threshold before proceeding. Low-quality RNA produces low-quality data, and no amount of downstream bioinformatics can fix that after the fact.
2. Library preparation: RNA is converted to cDNA, fragmented to a target size, and ligated to sequencing adapters. This step includes either ribosomal RNA depletion (rRNA accounts for ~90% of total cellular RNA) or poly-A selection (enriching for mRNA). The choice between these has downstream consequences for which RNA species are captured.
3. Sequencing: Libraries are loaded onto a sequencer, typically an Illumina instrument (the most used at least). Each fragment is read as a series of fluorescent signals and output as millions of short reads, usually 75–150 base pairs long. Single-end reads sequence from one end; paired-end reads sequence from both ends, giving better resolution of splice junctions and transcript structure.
4. Bioinformatics analysis: Raw reads are quality-controlled, aligned to a reference genome (or assembled de novo), and quantified per gene or transcript. Differential expression analysis then identifies genes that differ significantly between conditions. This phase is where the majority of analytical decisions are made (alignment tool, statistical model, thresholds,...) and where most of the biological signal is either recovered or lost.
5. Biological interpretation: Lists of differentially expressed genes are translated into biology. Pathway enrichment analyses ask whether the genes that change cluster in functionally coherent groups. This step turns a table of numbers into a mechanistic narrative.
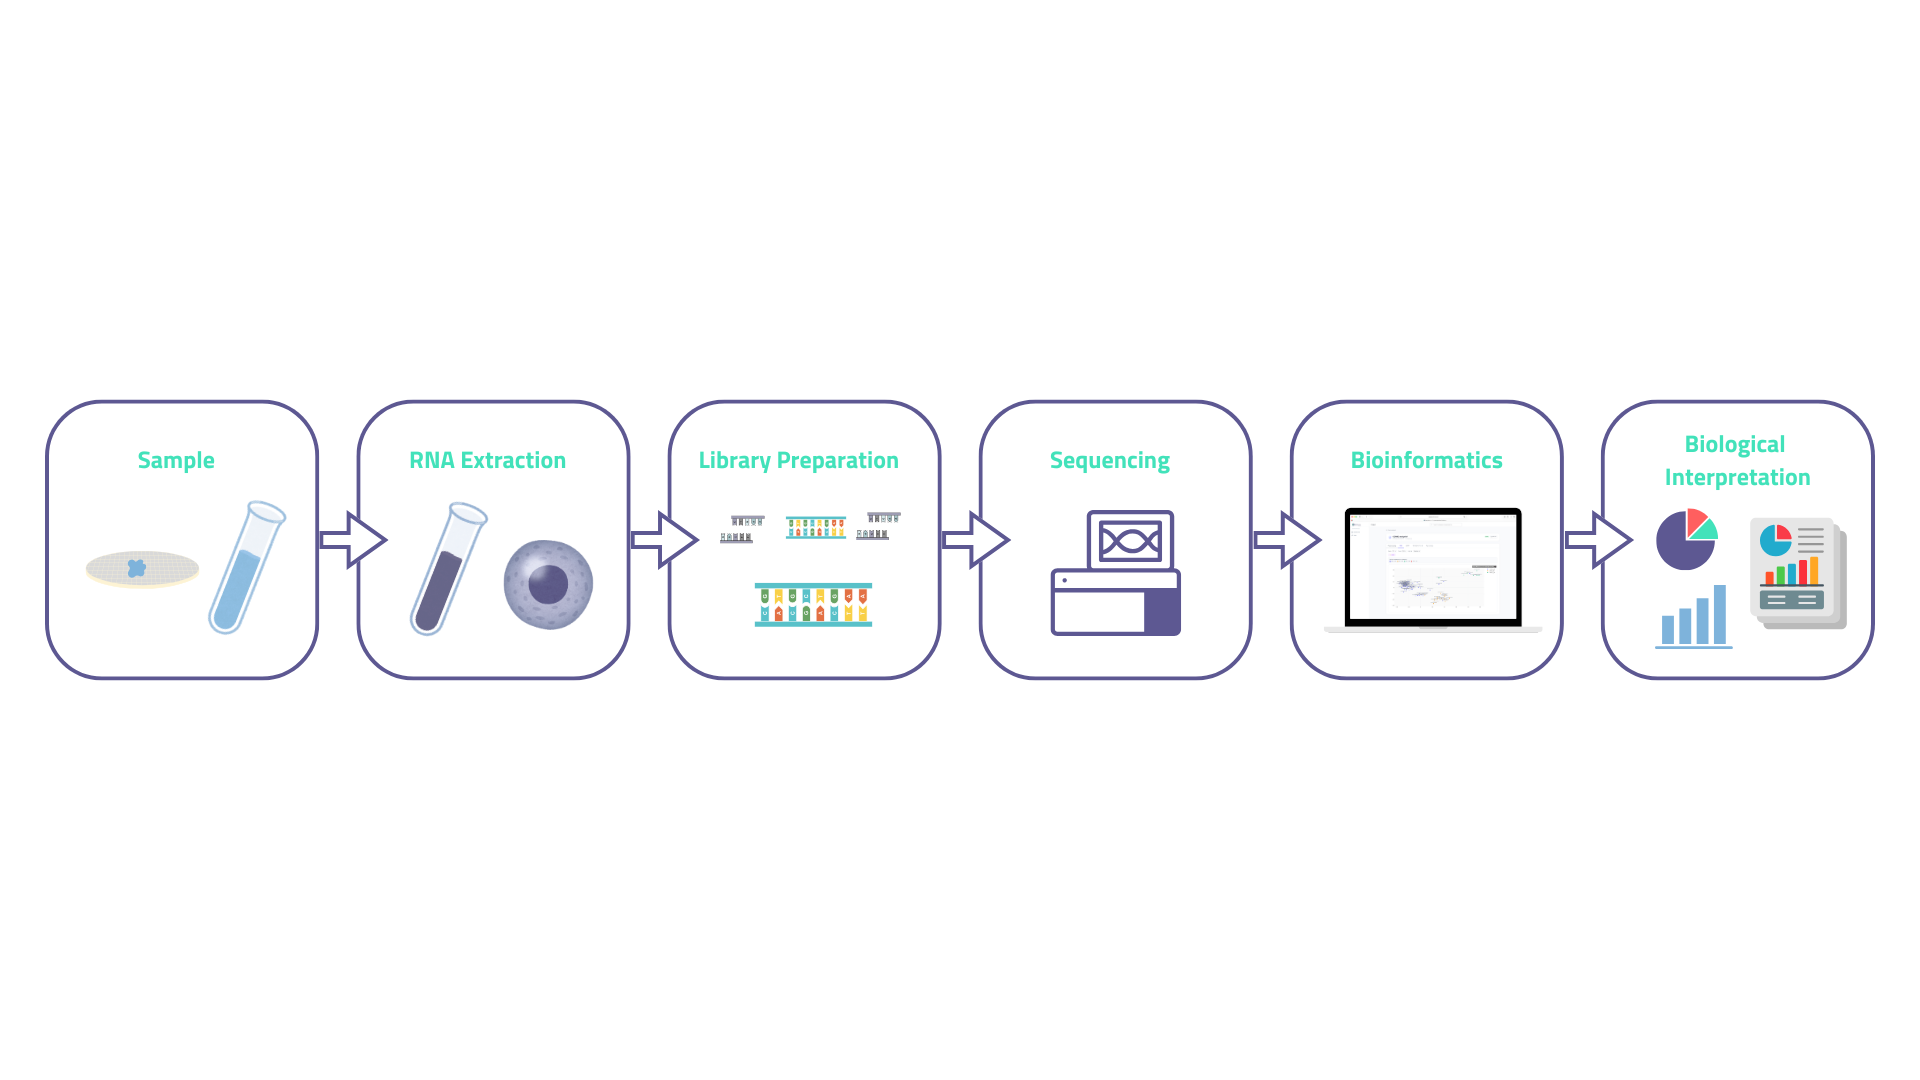
Figure 01 — Overview of the RNA-seq workflow from biological sample to biological interpretation. Each phase introduces specific quality checkpoints.
2. What Can RNA-seq Reveal?
Once the workflow is completed and the counts are in, the real question begins: what do all these numbers actually tell us? The answer depends on how the experiment was designed, but three categories of insight are consistently within reach.
Measuring gene expression
The most direct output is a comparison between conditions. In a typical two-condition experiment: treated versus untreated, diseased versus healthy, time point A versus time point B. RNA-seq identifies genes that are upregulated(expressed more in one condition - Up) or downregulated (expressed less - Down). The result is a statistical table: one row per gene, with a fold-change estimate and an adjusted p-value.
That table is not the conclusion. It is the starting point. A list of 800 differentially expressed genes tells you something changed; it does not tell you what's happened or why. The interpretation layers that follow are what turn data into understanding.
Understanding biological mechanisms
Where RNA-seq becomes genuinely powerful is at the level of coordinated gene programs. Inflammation is not a single gene changing, it is a cluster of cytokine genes, adhesion molecules, and transcription factors shifting together. RNA-seq captures that coordination in a way a targeted assay never could. The same logic applies to metabolic reprogramming, oxidative stress responses, and cell differentiation. When a cell makes a major decision, the transcriptome tends to reflect it as a coherent shift across dozens of functionally related genes, not a single blip.
This is arguably where transcriptomics earns its keep: not in identifying individual genes, but in reading the sentence made up of all those genes together.
Discovering biomarkers
RNA-seq has become a primary tool for biomarker discovery, particularly in clinical and pharmaceutical contexts. [1]
Three categories are relevant:
• Diagnostic biomarkers distinguish between disease states, or between disease and a healthy baseline. A gene (or gene signature) whose expression reliably separates the two groups is a candidate diagnostic marker.
• Prognostic biomarkers predict outcomes (like survival, disease progression, recurrence, ...) independently of treatment. They describe what the biology is doing, not what will happen in response to an intervention.
• Predictive biomarkers are arguably the most clinically valuable. They identify patients likely to respond (or not) to a specific treatment. This is the transcriptomic layer underneath precision medicine: the same diagnosis, but different biology, requiring different drugs.
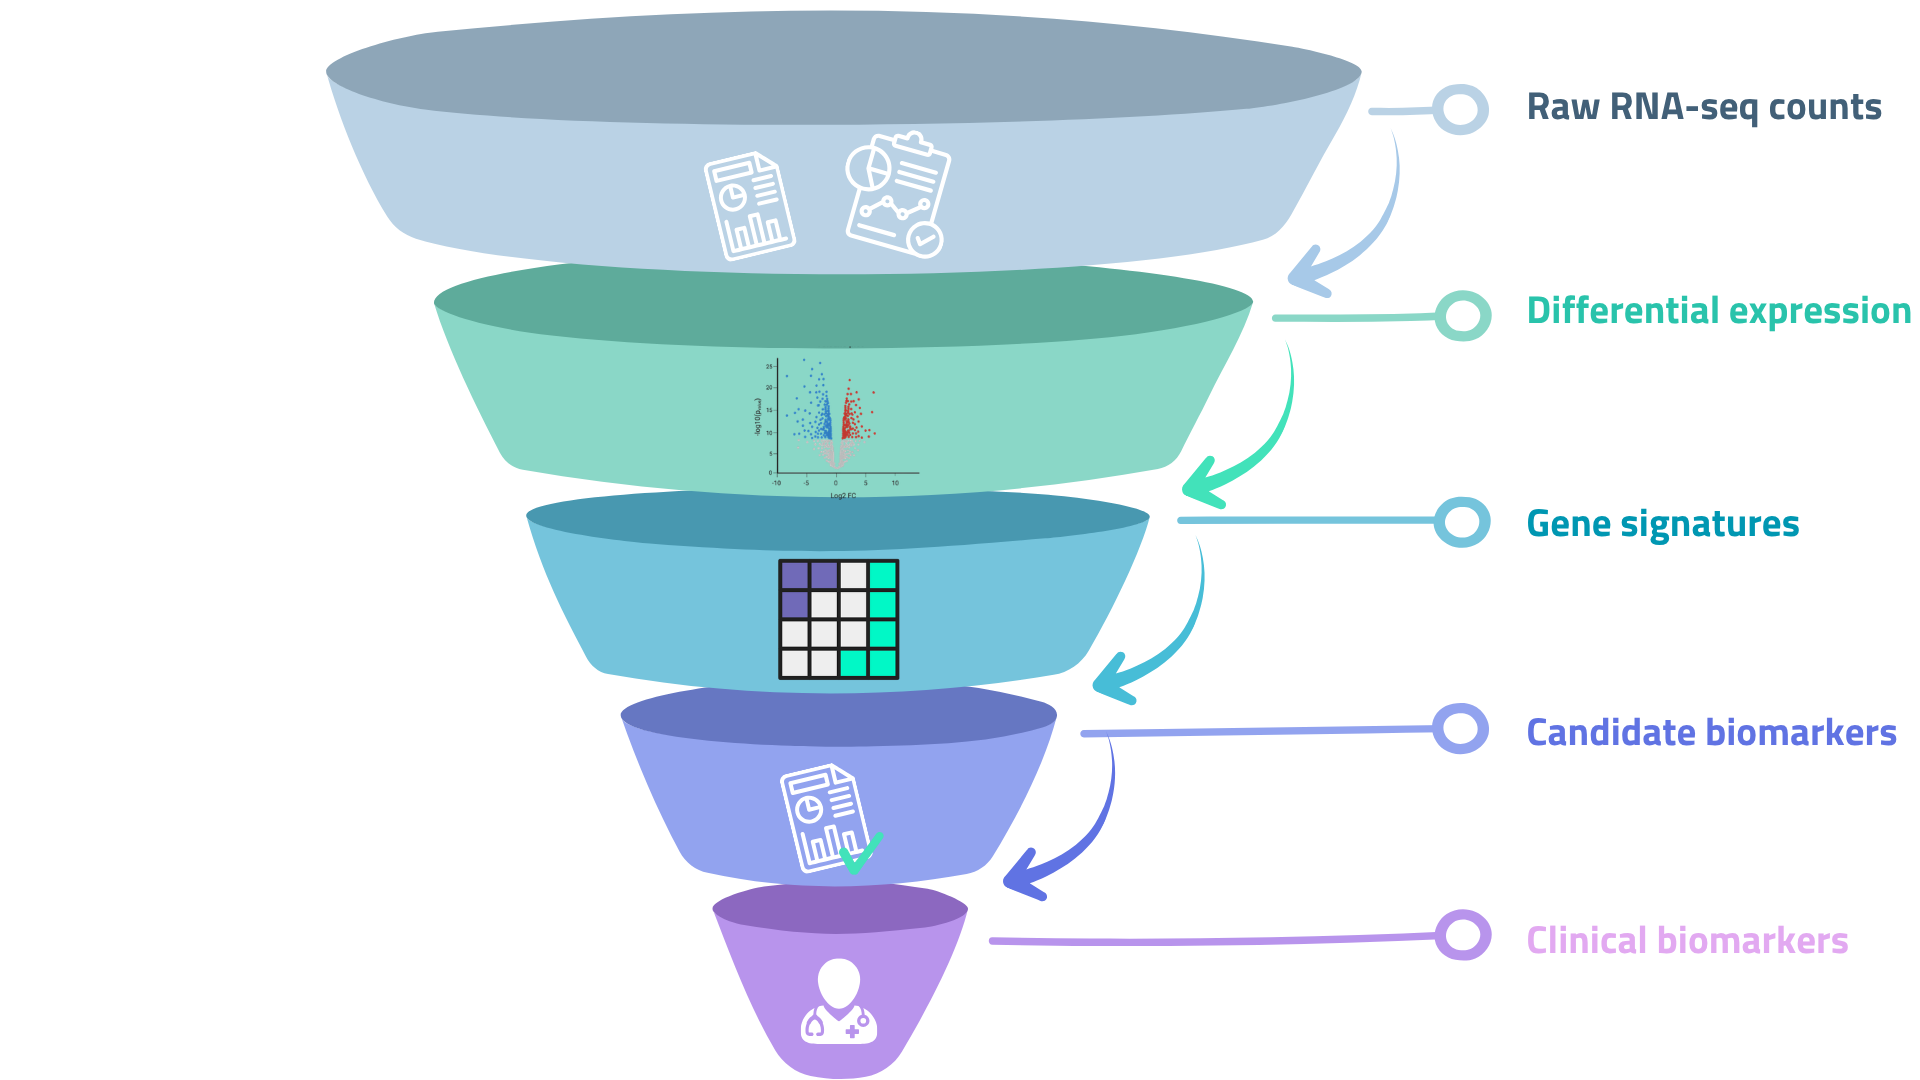
Figure 02 — RNA-seq data supports three distinct levels of biomarker discovery. Each level requires progressively more validation against independent cohorts.
3. Key Steps in a Successful RNA-seq Project
Knowing what RNA-seq can reveal is one thing. Getting it to actually reveal it is another. A technically sound experiment with a vague biological question produces data that is difficult to interpret. A well-framed question with poor experimental design produces data that is statistically unusable. The following sections cover both dimensions.
Experimental design
Define the biological question first
Before ordering reagents, write one sentence describing what you want to know. If you cannot do that, the experimental design will be unfocused and the results will be uninterpretable.
A question like "does compound X activate an inflammatory response at concentration Y in keratinocytes after 24 hours?" generates tractable, reproducible, actionable data. "Let's see what's happening" generates a very expensive spreadsheet.
Controls are part of this. The right control is not always the untreated vehicle — it depends on the question. Solvent controls, time-matched controls, and positive controls for pathway activation each answer different things. Missing one can make an experiment uninterpretable after the fact, when it is too late to add it.
COMMON PITFALL Using cell lines without verifying their identity or passage number. Transcriptomic data from a contaminated or heavily passaged line is not representative of the biology you think you are studying. This is more common than most labs admit and essentially invisible in the data unless controls are explicitly designed to detect it. |
Biological replicates are not optional!
Technical replicates detect protocol variability. Biological replicates (separate biological samples prepared independently) are what allow you to distinguish a real effect from noise. Only one of these provides statistical power.
The evidence is clear. A landmark study by Schurch et al. using 48 biological replicates per condition found that three replicates per group is a reasonable minimum, but that power to detect moderate fold changes improves substantially with five or six. [4]
The same analysis showed that tool choice interacts with replicate number: with three replicates, DESeq2 and limma outperform edgeR in controlling false discovery rates. Sequencing depth, by contrast, matters less than we can initially assume. Reducing it to 15% of standard depth had surprisingly little impact on detection rates in controlled simulations. [5]
The practical upshot: if your budget forces a choice between deeper sequencing per sample and more replicates, choose more replicates.
Data generation
RNA quality assessment
Confirm RNA integrity with a Bioanalyzer or Fragment Analyzer before preparing libraries. The RIN score threshold varies by protocol and tissue type (brain tissue degrades faster than blood) but any sample below 6 deserves scrutiny before proceeding. Concentration and purity metrics (A260/A280 and A260/A230 ratios) screen for protein and solvent contamination respectively. Neither is sufficient alone; use both together.
Sequencing strategy
Three decisions shape the sequencing design:
• Single-end vs. paired-end: Paired-end sequencing reads both ends of each fragment. It costs more but provides better alignment accuracy, more reliable quantification of alternatively spliced isoforms, and improved detection of fusion transcripts. For straightforward differential expression in well-annotated organisms, single-end at adequate depth is often sufficient.
• Sequencing depth: Standard recommendations for human gene expression studies range from 20 to 50 million reads per sample. Rare transcript detection and alternative splicing analyses require more. The exact number depends on the transcriptome complexity of your biological system.
• Read length: Longer reads (150 bp) improve alignment to repetitive regions and resolve isoforms better. Shorter reads (75 bp) suffice for gene-level quantification and reduce cost per read. Match length to purpose, not habit.
Bioinformatics analysis
This is the phase most often treated as a black box, because the decisions made here propagate directly into the biological conclusions. Understanding what the pipeline is doing, even without running it yourself, is essential for evaluating the results.
Raw data quality control
FastQC is the standard first step. It flags adapter contamination, base quality degradation at read ends, overrepresented sequences, and other technical artefacts. Trimmomatic or Trim Galore remove adapters and low-quality bases before alignment. Skipping this step does not save time, it defers problems to later stages where they are much harder to diagnose.
Read alignment and quantification
Two approaches dominate. Alignment-based methods (STAR, HISAT2) map reads to a reference genome at single-nucleotide resolution, producing BAM files from which per-gene counts are extracted. Pseudo-alignment methods(kallisto, Salmon) skip full alignment and instead determine transcript compatibility probabilistically, substantially faster and natively handling multi-mapping reads. [3] For gene-level differential expression, both approaches give highly concordant results. For isoform-level analysis, pseudo-alignment tends to be preferred.
Differential expression analysis
DESeq2, edgeR, and limma-voom are the three packages used in the vast majority of published RNA-seq studies. All model count data using a negative binomial distribution, which accounts for the overdispersion inherent to RNA-seq. They differ in normalisation strategy and dispersion estimation — in practice, with adequate replicates, results are generally comparable. [4][6] Genes are ranked by adjusted p-value (controlling the false discovery rate, typically at 5%) combined with a fold change threshold. A cutoff of |log₂FC| > 1 alongside adjusted p < 0.05 is common, though the appropriate values depend on the biological question and effect size expected.
Functional enrichment analysis
Gene Ontology (GO) enrichment tests whether genes in a given functional category appear in your differentially expressed list more often than chance would predict. KEGG and Reactome databases add metabolic and signalling pathway context. These analyses shift the focus from individual genes to biological processes, which is almost always where the interesting science actually lives.
A list of 500 differentially expressed genes is not a result. A finding that "the top-ranked upregulated genes are heavily enriched for type I interferon signalling terms" is.
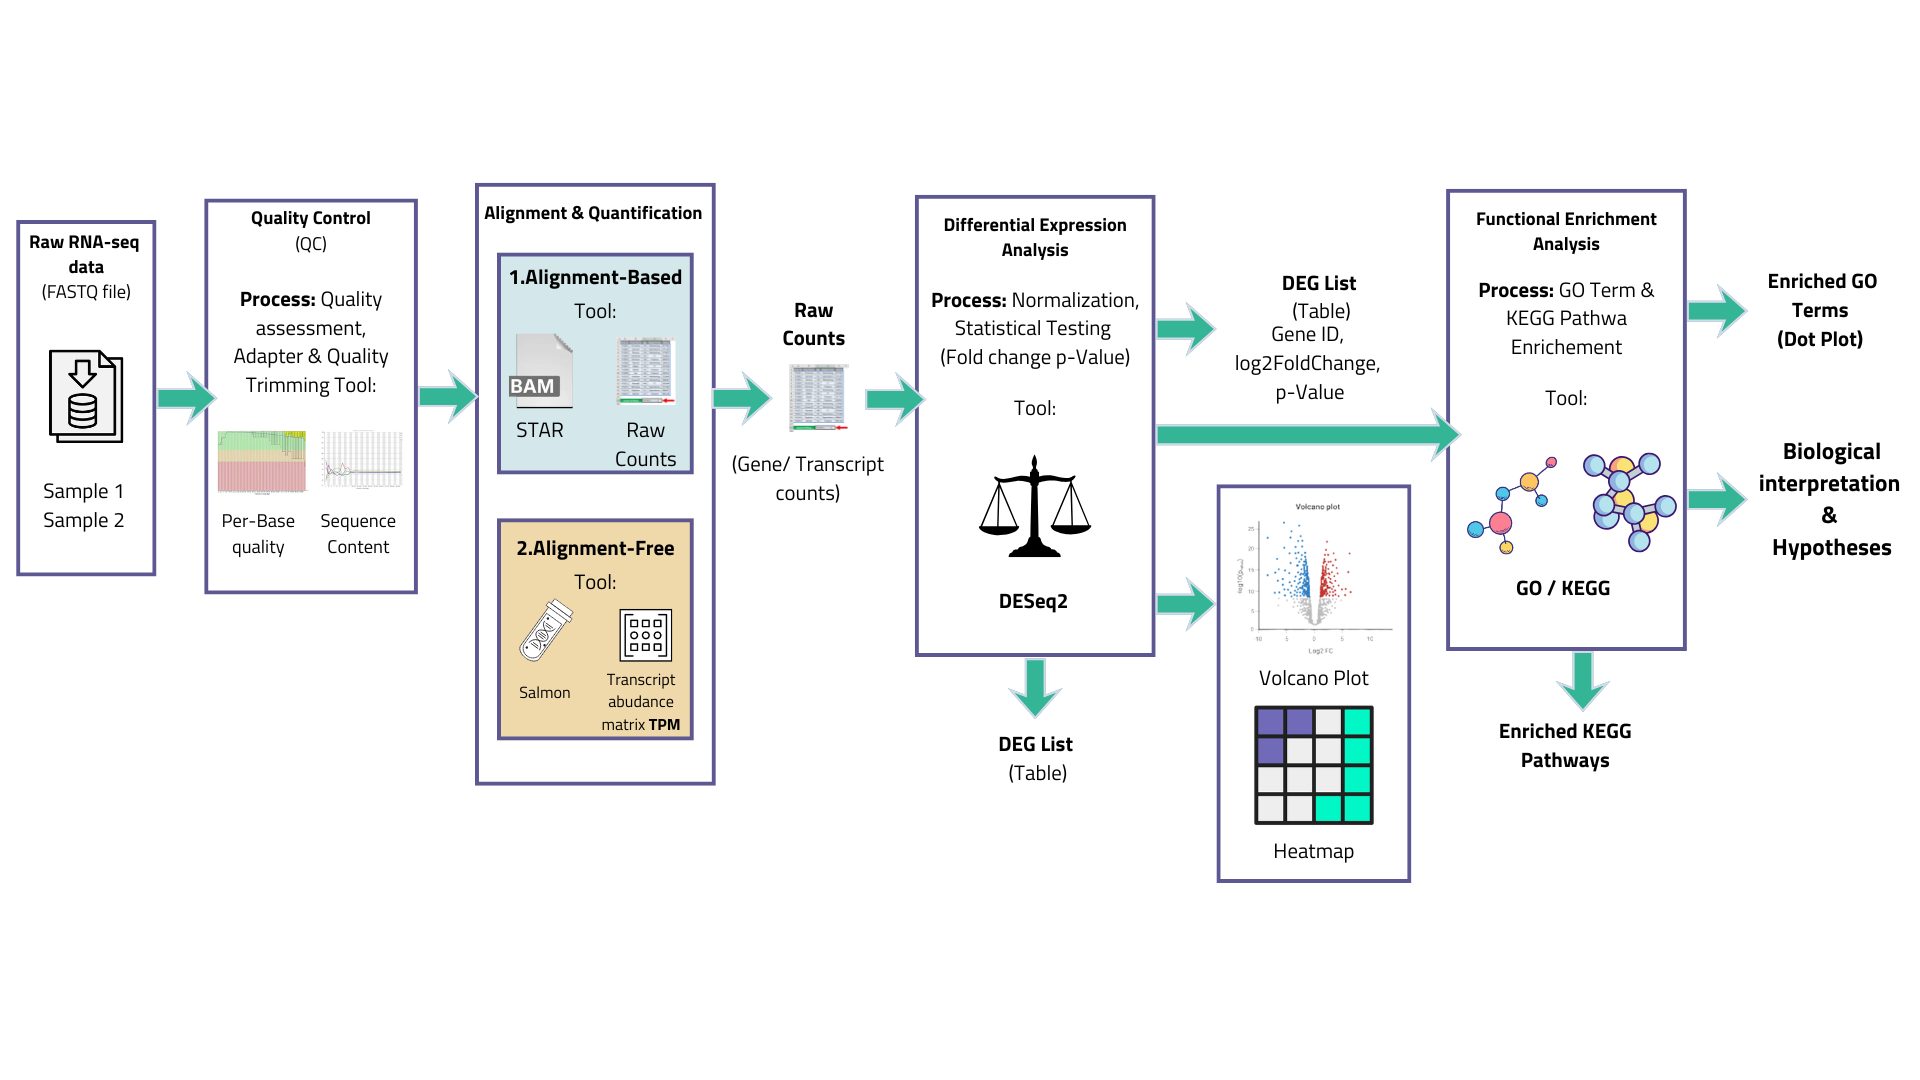
Figure 03 — Standard bioinformatics pipeline for bulk RNA-seq differential expression analysis. Tools shown are representative; alternatives exist at each step.
4. How to Interpret RNA-seq Results
Getting results back from a sequencing run is a milestone. But the analysis is where most of the intellectual work happens. This section covers the main visualisation and interpretation tools used in practice.
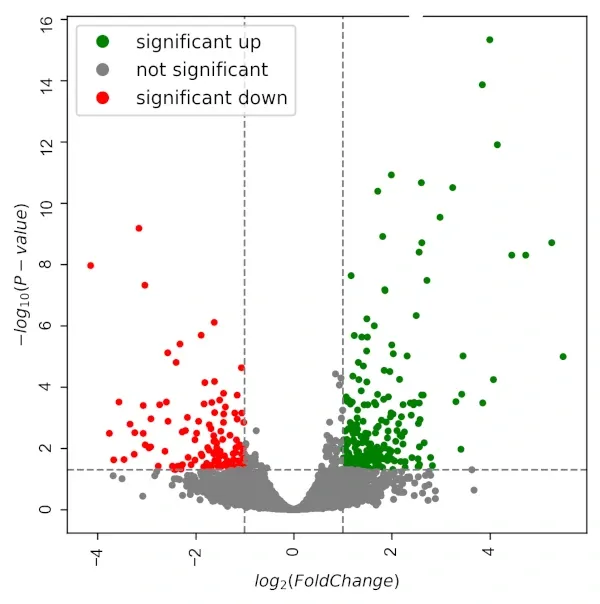
Volcano plots
A volcano plot places every tested gene in two-dimensional space: fold change on the x-axis, statistical significance on the y-axis. Genes with large fold changes and high significance appear at the top corners. They communicate the overall structure of a comparison at a glance: how many genes change, in which direction, and at what effect size.
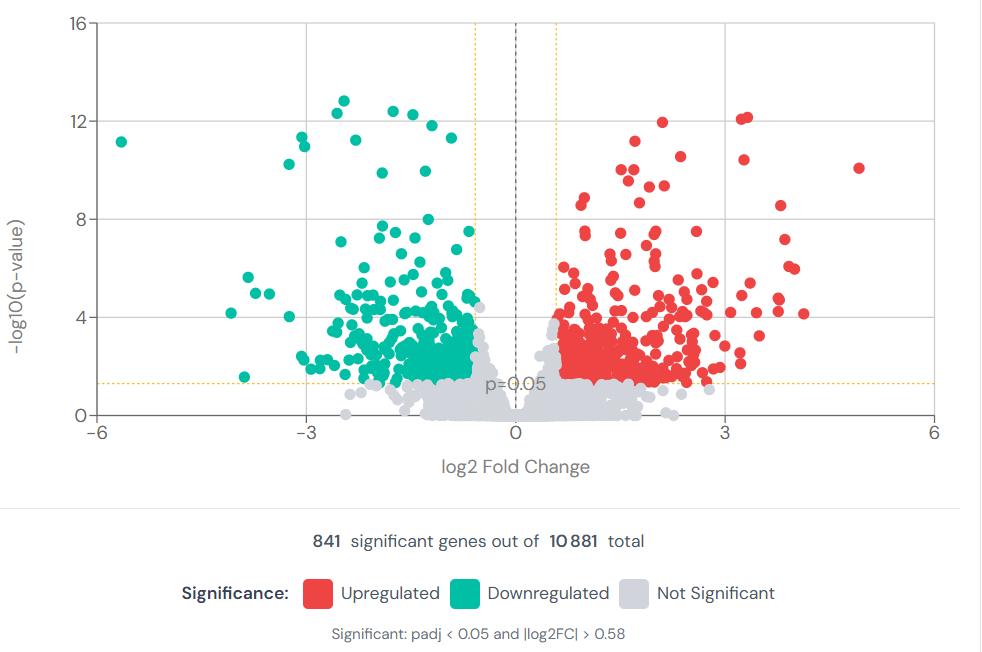
Figure 04 — Volcano Plot
What volcano plots do not show is whether any of it matters biologically. A gene with a log₂FC of 5 and p = 10⁻¹² might be a contaminant artefact. A gene with modest significance might be the rate-limiting step in a key pathway. Statistical significance and biological relevance are not synonyms.
Heatmaps
Heatmaps visualise expression patterns across samples and genes simultaneously. Clustered versions, where rows and columns are grouped by similarity, reveal structure that a table cannot highlight: gene that behave coherently, samples that cluster with their expected condition (or unexpectedly do not), and outlier samples that warrant investigation before inclusion in downstream analyses.
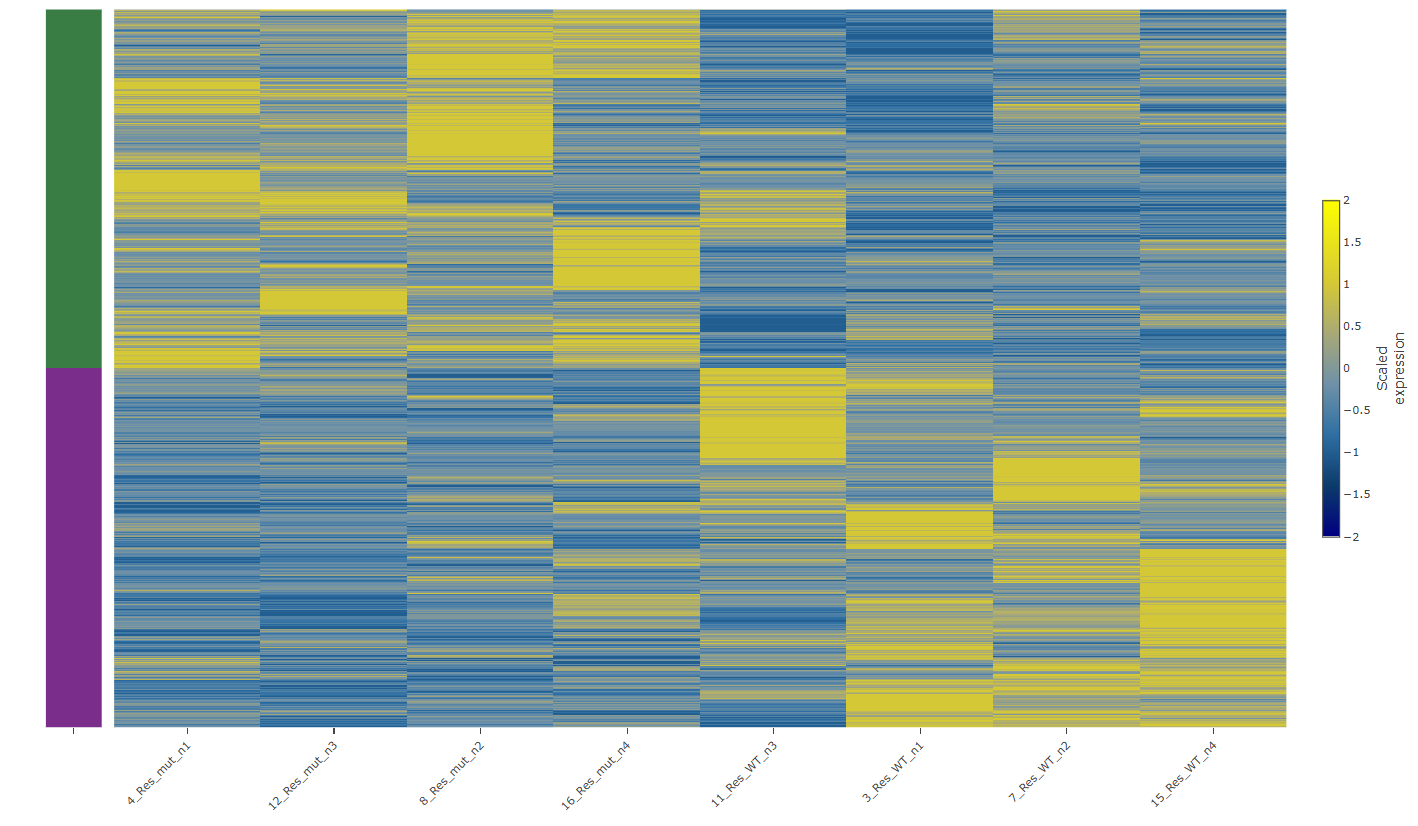
Figure 05 — Heatmap of gene expression across the different samples
A heatmap that shows clean separation between conditions is reassuring. One that does not should prompt a question: is the biology complex, or is something wrong with the samples?
Pathway analysis
This is where biological interpretation concretely happens. Methods range from simple over-representation testing (Fisher's exact test on GO categories) to approaches that account for gene-set size and network topology (GSEA, camera, fgsea). The choice of database matters: GO, KEGG, Reactome, and MSigDB curate overlapping but distinct gene function associations, and results are not always consistent between databases. Running two and comparing is rarely a bad idea.
Gene expression signatures
A signature is a defined set of genes whose expression pattern is associated with a biological state: a cell type, a disease stage, a treatment response. Signatures can classify samples, score pathway activity, or benchmark new experiments against reference datasets. Building a robust signature requires validation across independent cohorts and technologies. A signature that "works" only in the dataset that generated it is not a signature, it is overfitting.
5. Bulk RNA-seq vs. Single-Cell RNA-seq
Bulk and single-cell RNA-seq are not competing technologies, they answer fundamentally different questions. Choosing between them is not a matter of preference or budget alone, but of what the biology actually requires.
Bulk RNA-seq | Single-Cell RNA-seq | |
What it measures | Average expression across all cells | Expression in each individual cell |
Resolution | Population-level | Single-cell level |
Cost | Lower (€150–400/sample library prep) | Higher (~€5,000–10,000 per run) |
Analysis | Moderate: well-established workflows | Complex: clustering, batch correction, cell annotation |
Key strength | Statistical power, robust quantification | Reveals cell-type heterogeneity and rare populations |
Key limitation | Masks subpopulation differences | High dropout noise per cell |
Best for | Treatment response, biomarker studies | Tumour microenvironment, developmental atlases |
Bulk RNA-seq averages expression across every cell in the input sample. That is fine when the cell population is reasonably homogeneous or when the comparison is at the tissue level. In a skin biopsy or a cell line experiment, tissue-level response to treatment is usually the relevant unit of analysis.
Single-cell RNA-seq (scRNA-seq) becomes necessary when heterogeneity is the question. A tumour is not a uniform mass of cancer cells, it contains malignant cells, stromal fibroblasts, endothelial cells, and multiple immune populations, each with its own transcriptional state. [7][8] Bulk RNA-seq averages all of that together. scRNA-seq profiles each cell separately, enabling identification of rare populations, reconstruction of differentiation trajectories, and analysis of cell-cell interactions with a resolution that bulk approaches simply cannot provide.
PRACTICAL RULE OF THUMB If the question is "does treatment X change expression of pathway Y in my cells", bulk RNA-seq with good replicates is the right choice. If the question is "which cell type is driving the response, and how are different populations communicating", you need single-cell resolution. |
6. Applications of RNA-seq
One of RNA-seq's strengths is that the same core technology applies across radically different scientific domains. The biology changes; the method stays essentially constant.
Biomedical research
RNA-seq has become infrastructure in biomedical research. In cancer, it drives tumour subtype classification, neoantigen prediction, and fusion gene detection. Large initiatives like The Cancer Genome Atlas (TCGA) have profiled thousands of tumour transcriptomes, creating reference datasets that underpin much of modern oncology. In immunology, single-cell RNA-seq has produced human cell atlases reclassifying immune populations with far more granularity than surface markers alone allow.
For rare disease diagnosis, RNA-seq is proving particularly valuable: aberrant splicing events and allele-specific expression changes that are invisible in whole-exome sequencing data become detectable at the RNA level. [1] This is an area where access to large, matched genomic-transcriptomic biobanks is increasingly important for establishing what a normal expression profile looks like, without that reference, interpreting an outlier is difficult.
Toxicology
Mechanistic toxicology depends on understanding not just whether a compound is toxic, but why: which pathways it perturbs, at what dose, and through which molecular events. RNA-seq enables genome-wide toxicogenomics, kind of unbiased view of the transcriptional response to a chemical, revealing off-target effects and mode-of-action insights before phenotypic changes appear. In the context of the Adverse Outcome Pathway (AOP) framework, transcriptomic data can populate key event measurements with unprecedented resolution and without the need to pre-specify hypotheses.
Cosmetics and personal care
The cosmetics industry adopted transcriptomics also du to regulatory pressure to eliminate animal testing created demand for sophisticated in vitro alternatives, and partly because mechanism-of-action claims increasingly require molecular-level evidence. You could say the industry had to express itself differently.
RNA-seq can profile how skin cells respond to a formulation (, identify the biological processes activated or suppressed, and provide objective quantitative evidence for efficacy claims. For a moisturiser claiming to reinforce the epidermal barrier, a transcriptomic study showing upregulation of filaggrin, loricrin, and tight-junction genes is a materially stronger evidential basis than a consumer perception survey.
Drug development
Transcriptomics contributes at every stage of drug development. In target discovery, RNA-seq profiles of disease tissue identify dysregulated genes and pathways as intervention hypotheses.
In clinical development, patient stratification based on baseline transcriptomic profiles identifies who is most likely to respond to a given compound. In post-market work, expression changes in biobanked samples can link transcriptomic signatures to clinical outcomes retrospectively, and accelerate the next hypothesis cycle.
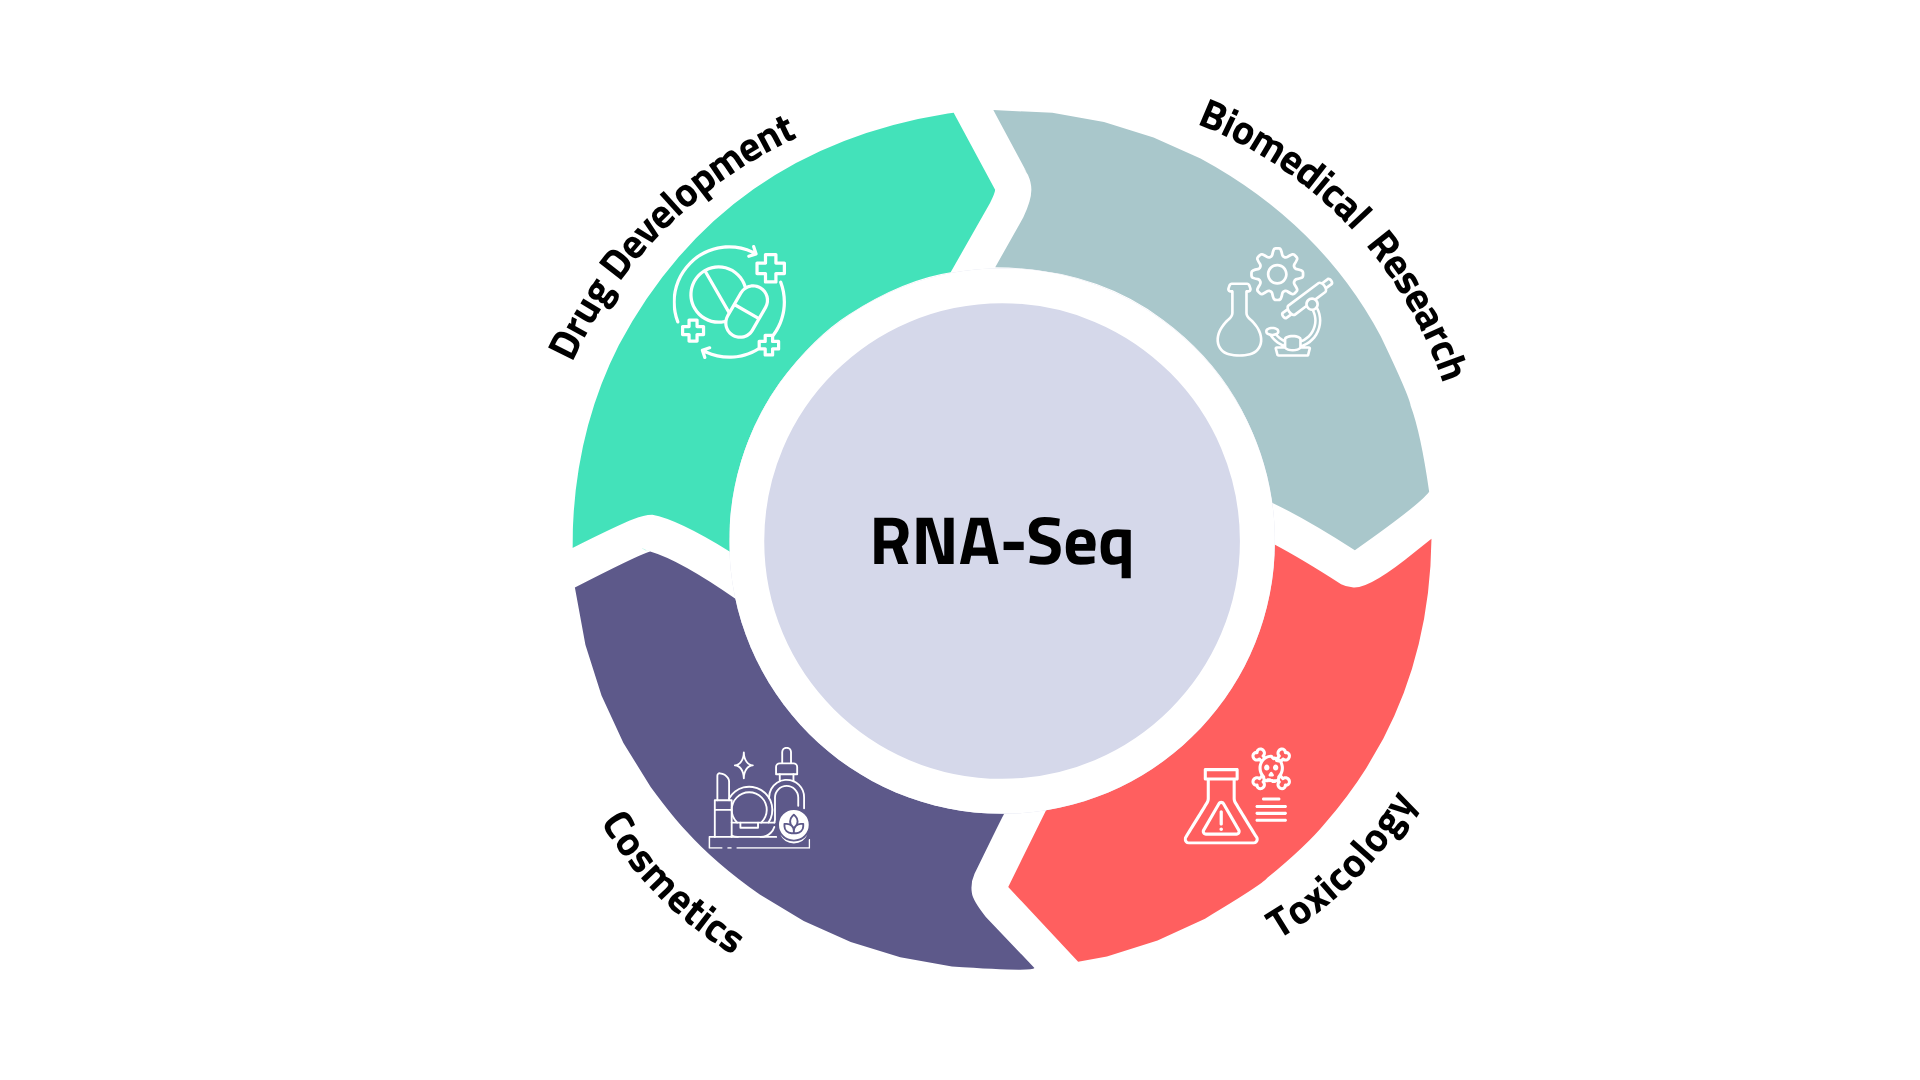
Figure 06 — Main application domains for RNA-seq in applied and clinical research. The core technology is shared; the biological questions and regulatory contexts differ substantially between sectors.
7. Challenges and Limitations of RNA-seq
No technology is a free lunch, and RNA-seq is no exception. Understanding its limitations is as important as knowing what it can do, particularly when interpreting results or designing a study budget.
Cost
Sequencing costs per base have fallen by orders of magnitude over the past two decades. But a complete RNA-seq experiment — RNA extraction, library preparation, sequencing, and analysis — still costs several hundred to several thousand euros per sample once all components are accounted for. Running a study with six conditions and five replicates each, at full depth, is not a trivial investment for an academic lab or a small CRO. Cost-effective protocols such as BRB-seq (covered in Section 8) are beginning to change this equation, but the barrier has not disappeared.
Data complexity
A typical human RNA-seq dataset contains expression counts for ~20,000 genes across 20–30 samples. The number of analytic choices, alignment tool, quantification method, normalisation strategy, statistical model, multiple testing approach, pathway database is large, and different choices can produce meaningfully different biological conclusions. There is no single correct pipeline. There are principled choices and less principled ones, and the difference between them is not always obvious from the outside.
Biological variability
Cells are not deterministic machines. Even genetically identical cells in the same culture well show transcriptional heterogeneity. At the organism level, individual variation, circadian rhythms, and microenvironmental factors all contribute noise. Replicates are the answer but an underpowered study will miss real effects, and an overpowered one will declare biologically trivial differences statistically significant. Matching power to the effect size you are trying to detect is a design decision, not an afterthought.
Bioinformatics requirements
Running a complete RNA-seq analysis pipeline requires computational resources, command-line fluency, and statistical literacy. Access to high-performance computing helps for large datasets.
The barrier is lower than it was five / eight years ago, workflow managers like Snakemake and Nextflow have made pipelines more reproducible and portable but it has not disappeared.
From data to biology
This is the hardest part, and arguably the most underrated. A list of differentially expressed genes is not an insight. The step from "gene X is upregulated 3-fold" to "this means the cell is doing Y, which has consequence Z" requires domain expertise, careful integration with prior knowledge, and honest acknowledgment of what the data does not tell you.
Over-interpretation of RNA-seq results treating a statistical association as a causal mechanism is one of the most common ways transcriptomic studies mislead readers. Correlation between gene expression and a phenotype is a starting point, not a conclusion.
8. Emerging Trends in Transcriptomics
The field is not standing still. Several technological and methodological developments are actively reshaping what is possible, at what cost, and at what resolution.
High-throughput, cost-effective methods
One persistent criticism of conventional RNA-seq is that library preparation is too laborious and expensive for large-scale screens. BRB-seq (Bulk RNA Barcoding and sequencing), developed by Deplancke's group at EPFL, addresses this directly.
By introducing sample barcodes early in the protocol and pooling samples before library construction, it achieves up to 25-fold cost reduction relative to standard TruSeq workflows, while maintaining comparable performance, including tolerance for lower-quality RNA. [9][10] Libraries for up to 192 samples can be prepared in a single day with approximately two hours of hands-on time. [9]
This changes the economics of experiments requiring large numbers of samples: toxicology dose-response screens, population studies, and multi-condition time courses all become feasible at scales that were previously unworkable for most budgets.
Single-cell transcriptomics
The single-cell field has matured from specialised niche to standard method at major research institutions. Droplet-based platforms (10x Genomics Chromium) have brought per-cell costs down substantially; combinatorial barcoding approaches like SPLiT-seq have pushed them further, to costs reportedly below one cent per cell. [11]
The main remaining challenge is not sequencing cost but downstream analysis: cell clustering, trajectory inference, batch correction, and cell-type annotation each require specific computational expertise, and no universally agreed standards exist yet.
Spatial transcriptomics
Single-cell RNA-seq loses one piece of information that is often critical: where in the tissue each cell was located. Spatial transcriptomics methods recover that context by sequencing RNA while preserving spatial coordinates through array-based capture (Visium), in situ hybridisation, or imaging-based approaches. In cancer biology, knowing that a gene is expressed specifically at the tumour-stroma interface is a fundamentally different kind of knowledge than knowing it is expressed in some fraction of cells in a dissociated sample. [8][12]
The integration of single-cell and spatial transcriptomic data is currently one of the most active methodological frontiers in the field and one of the most computationally demanding.
Multi-omics integration
Transcriptomics has never been an island. Combining RNA-seq with proteomics, metabolomics, epigenomics, or genomics gives a more complete picture of what is happening in a biological system. Each data type has its own noise structure and analytic requirements, which makes integration technically demanding. But the biological insight generated often cannot be obtained from any single modality alone — the transcriptome tells you what genes are active, but not how much protein was made, or whether a metabolic bottleneck exists downstream. [2]
Artificial intelligence in transcriptomics
Machine learning applications in transcriptomics range from practical to ambitious. At the practical end: better cell-type classification in scRNA-seq, improved batch correction, and more robust pathway scoring. At the ambitious end: foundation models trained on millions of expression profiles, aiming to predict transcriptional responses to unseen perturbations from first principles.
The grander claims deserve scrutiny. "Predict drug response from transcriptomics alone" is a proposition that requires rigorous prospective validation before it should change clinical practice. What AI unambiguously contributes today is speed and scale — processing datasets that would take weeks to analyse manually, in hours. Whether the interpretations it produces are correct is a separate question, and one that still requires domain expertise to evaluate.
Figure 07 — Positioning of major transcriptomics approaches by cost and resolution. Cost estimates are approximate and evolve rapidly as technology matures.
9. Best Practices for a Successful RNA-seq Study
Synthesising the preceding sections into actionable guidance, five principles distinguish studies that produce reliable, interpretable results from those that do not.
Start with a clear biological question: Before ordering reagents, write one sentence describing what you want to know. If you cannot, redesign the experiment. The question shapes the comparison, the controls, and the statistical analysis. Everything else follows from it.
Design robust experiments: Minimum three biological replicates per condition, ideally five or six for moderate effect sizes. Randomise sample handling. Include appropriate controls. Pre-register the analysis plan for studies that will inform publications or decisions.
Ensure data quality at every step: Check RNA integrity before library preparation. Run QC on raw reads. Inspect alignment rates and gene body coverage before differential expression analysis. An experiment with a 40% alignment rate has a problem that needs diagnosing.
Apply appropriate statistical methods: Use negative-binomial models for count data from adequately replicated experiments. Correct for multiple testing using FDR. Report fold changes alongside significance values. A gene can be statistically significant with a biologically negligible fold change at very high sequencing depth, both pieces of information matter.
Focus on biological interpretation: The goal is not a list of differentially expressed genes. It is an understanding of what the biology is doing. Pathway enrichment analysis, gene module visualisation, and integration with prior knowledge are not optional extras. They are the point.
Conclusion
RNA-seq is, at its core, a listening technology. It asks cells what they are saying without specifying in advance what the answer should be. That openness is its central advantage over the tools it replaced, and it is why it has become the standard for transcriptomic studies across biomedical research, toxicology, cosmetics, and drug development.
But the technology is only as good as the experiment around it. An underpowered study with two replicates and no clear biological question produces a list of numbers that means very little. A well-designed experiment (right comparison, right controls, replicates, clean RNA) produces data that can genuinely change understanding.
The field continues to evolve. Spatial transcriptomics adds tissue architecture. Single-cell methods resolve heterogeneity that bulk approaches flatten. Cost-effective protocols like BRB-seq make large-scale experiments accessible. Multi-omics integration connects the transcriptome to the proteome, the epigenome, and the metabolome in ways no single technology can replicate.
The biological insight, though, still comes from the same place it always has: combining good experimental design with careful analysis and enough domain knowledge to know what a result actually means and what it does not.
References
[1] Smail CR, Montgomery SB. RNA Sequencing in Disease Diagnosis. Annu Rev Genomics Hum Genet. 2024;25:353–367. doi:10.1146/annurev-genom-021623-121812
[2] Antoszewski K, Chmielewska K, Jagiello K, Puzyn T. Designing RNA sequencing experiments: A practical guide to reproducible gene expression analysis. Comput Struct Biotechnol J. 2025. doi:10.1016/j.csbj.2025.12.015
[3] Wikipedia contributors. RNA-Seq. Wikipedia, The Free Encyclopedia. https://en.wikipedia.org/wiki/RNA-Seq
[4] Schurch NJ, Schofield P, Gierliński M, et al. How many biological replicates are needed in an RNA-seq experiment and which differential expression tool should you use? RNA. 2016;22(6):839–851. doi:10.1261/rna.053959.115
[5] Hart SN, Therneau TM, Zhang Y, Poland GA, Kocher JP. Efficient experimental design and analysis strategies for the detection of differential expression using RNA-Sequencing. PLOS ONE. 2013;8(8):e65612. doi:10.1371/journal.pone.0065612
[6] Manzoor F, Tsurgeon CA, Gupta V. Exploring RNA-Seq Data Analysis Through Visualization Techniques and Tools. Bioengineering. 2025;12(1):56. doi:10.3390/bioengineering12010056
[7] Ahmed R, Zaman T, Chowdhury F, et al. Single-Cell RNA Sequencing with Spatial Transcriptomics of Cancer Tissues. Int J Mol Sci. 2022;23(6):3042. doi:10.3390/ijms23063042
[8] Yang X, et al. Advances in spatial transcriptomics and its applications in cancer research. Mol Cancer. 2024. doi:10.1186/s12943-024-02040-9
[9] Alpern D, Gardeux V, Russeil J, et al. BRB-seq: ultra-affordable high-throughput transcriptomics enabled by bulk RNA barcoding and sequencing. Genome Biol. 2019;20:71. doi:10.1186/s13059-019-1671-x
[10] Alithea Genomics. What is BRB-seq? Alithea Genomics Blog. 2024. https://alitheagenomics.com/blog/post/what-is-brb-seq
[11] Shi W, Zhang Z, Xu X, et al. Single-cell and spatial transcriptomics integration: new frontiers in tumor microenvironment and cellular communication. Front Immunol. 2025;16:1649468. doi:10.3389/fimmu.2025.1649468
[12] Rosenberg AB, et al. Single-cell profiling of the developing mouse brain and spinal cord with split-pool barcoding. Science. 2018;360(6385):176–182. doi:10.1126/science.aam8999